
Bootstrap a NodeJS Koa server like this.
mkdir dashboard-node
cd dashboard-node
npm init -y
yarn add koa koa-combine-routers koa-router pino-http prom-client
Add this script
package.json
...
"scripts": {
    "dev": "npx nodemon server.js",
  },
...
Create an entry point.
server.js
const {
    collectDefaultMetrics
} = require('prom-client')
collectDefaultMetrics({
    timeout: 5000
})
const Koa = require('koa')
const router = require('./routes')

const PORT = process.env.PORT || 3000

const app = new Koa()
app.use(router())

app.listen(PORT, () => {
    console.log('Server running on port ' + PORT)
})routes/index.js
const combineRouters = require('koa-combine-routers')
const rootRouter = require('./root')
const metricsRouter = require('./metrics')
const {
    Counter,
    Gauge
} = require('prom-client')
const {
    startTime
} = require('pino-http')

const httpMetricsLabelNames = ['method', 'path']
const totalHttpRequestCount = new Counter({
    name: 'nodejs_http_total_count',
    help: 'total request number',
    labelNames: httpMetricsLabelNames,
})
const totalHttpRequestDuration = new Gauge({
    name: 'nodejs_http_total_duration',
    help: 'the last duration or response time of last request',
    labelNames: httpMetricsLabelNames,
})

function initMetrics4EachRoute(layer) {
    layer.stack.unshift(async (ctx, next) => {
        await next()
        totalHttpRequestCount.labels(ctx.method, layer.path).inc()
        // start time symbol defined in pino-http
        totalHttpRequestDuration
            .labels(ctx.method, layer.path)
            .inc(new Date().valueOf() - ctx.res[startTime])
    })
}

rootRouter.stack.forEach(initMetrics4EachRoute)

const router = combineRouters(rootRouter, metricsRouter)

module.exports = router
routes/root.js
const Router = require('koa-router')
const router = new Router()

router.get('/', async (ctx, next) => {
    ctx.body = 'Hello'
})

module.exports = router
routes/metrics.js
const Router = require('koa-router')
const {
    register
} = require('prom-client')

const router = new Router()
router.get('/metrics', (ctx) => {
    ctx.headers['content-type'] = register.contentType
    ctx.body = register.metrics()
})

module.exports = router
#Test it
Start our server and test it like this.
yarn dev
 curl http://localhost:3000/
curl http://localhost:3000/metricsdocker-compose.yml
version: '3'
services:
  prometheus:
    image: prom/prometheus:0.18.0
    volumes:
      - ./prometheus.yml:/etc/prometheus/prometheus.yml
    command:
      - '-config.file=/etc/prometheus/prometheus.yml'
    ports:
      - '9090:9090'
  grafana:
    image: grafana/grafana
    ports:
      - 3001:3000
prometheus.yml
global:
  scrape_interval: 5s
  external_labels:
    monitor: 'my-monitor'
scrape_configs:
  - job_name: 'prometheus'
    target_groups:
      - targets: ['localhost:9090']
  - job_name: 'todo-service'
    metrics_path: '/metrics'
    target_groups:
      - targets: ['host.docker.internal:3000']
Start the services.
docker-compose upConfirm Prometheus is running at http://localhost:9090/. If it doesn’t start, check the YAML spacing. (Don’t get me started on YAML. It’s so stupid)
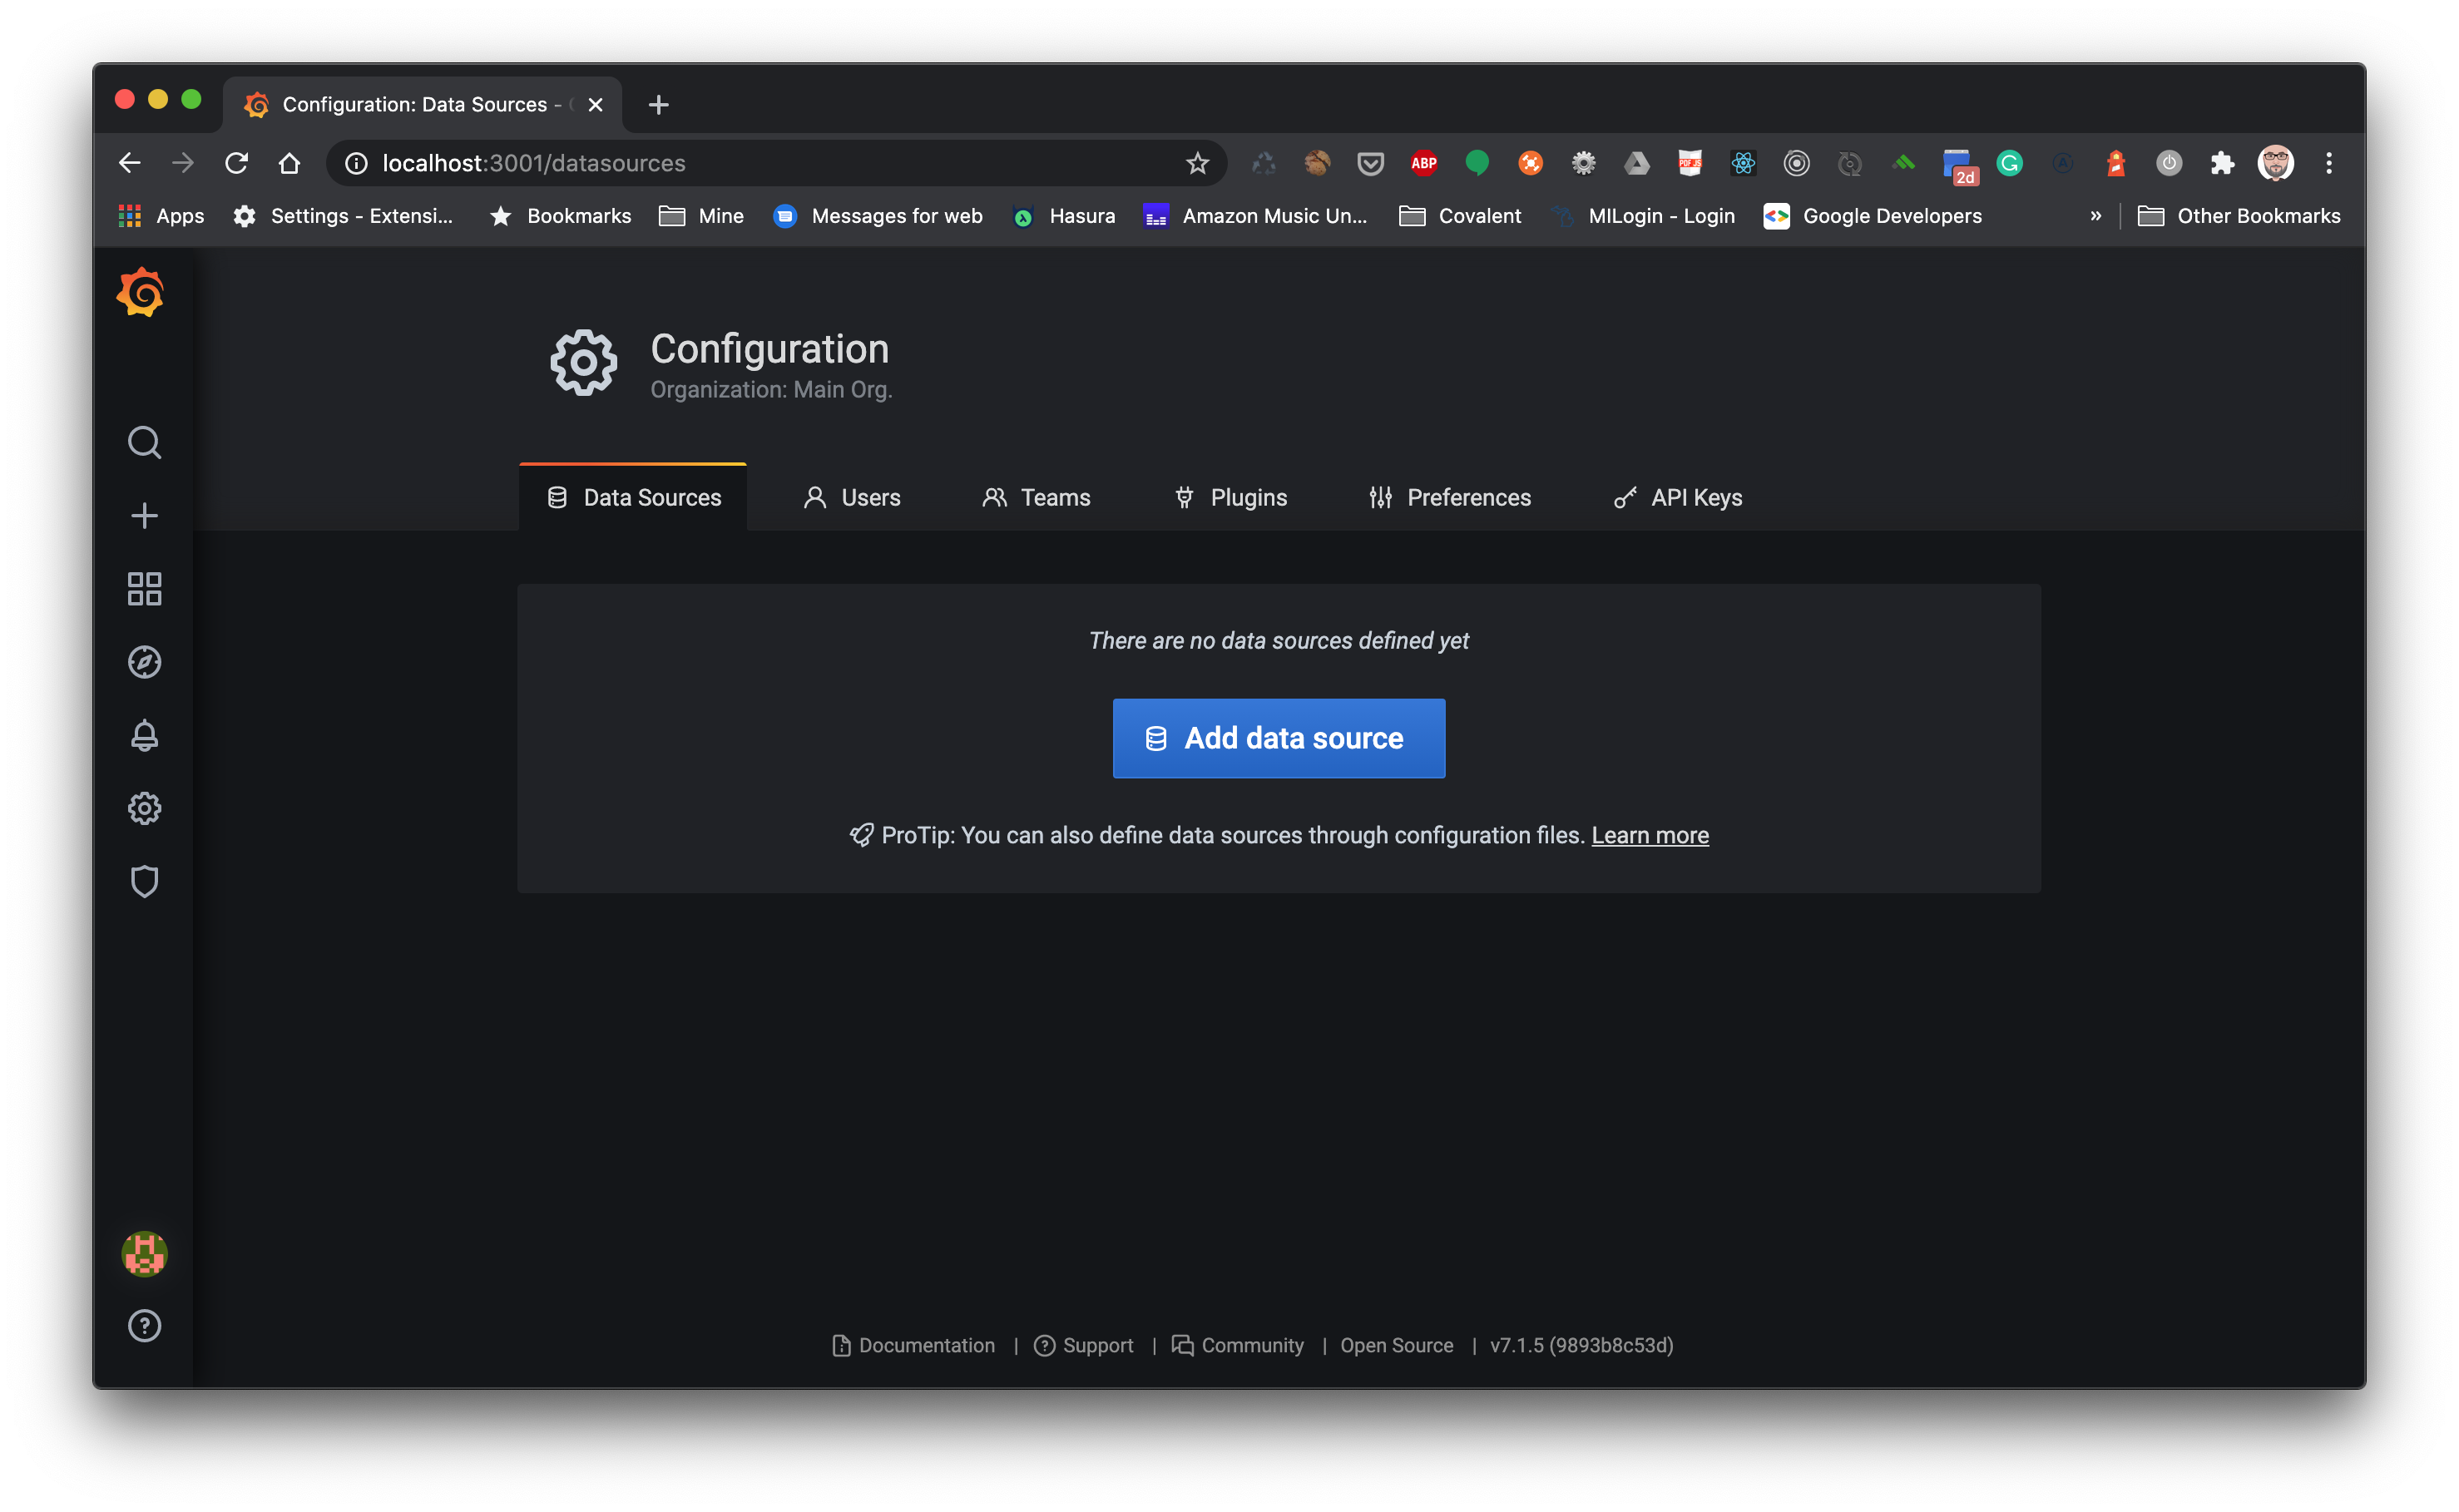
Login into Grafana with username = admin and password = admin at http://localhost:3001/
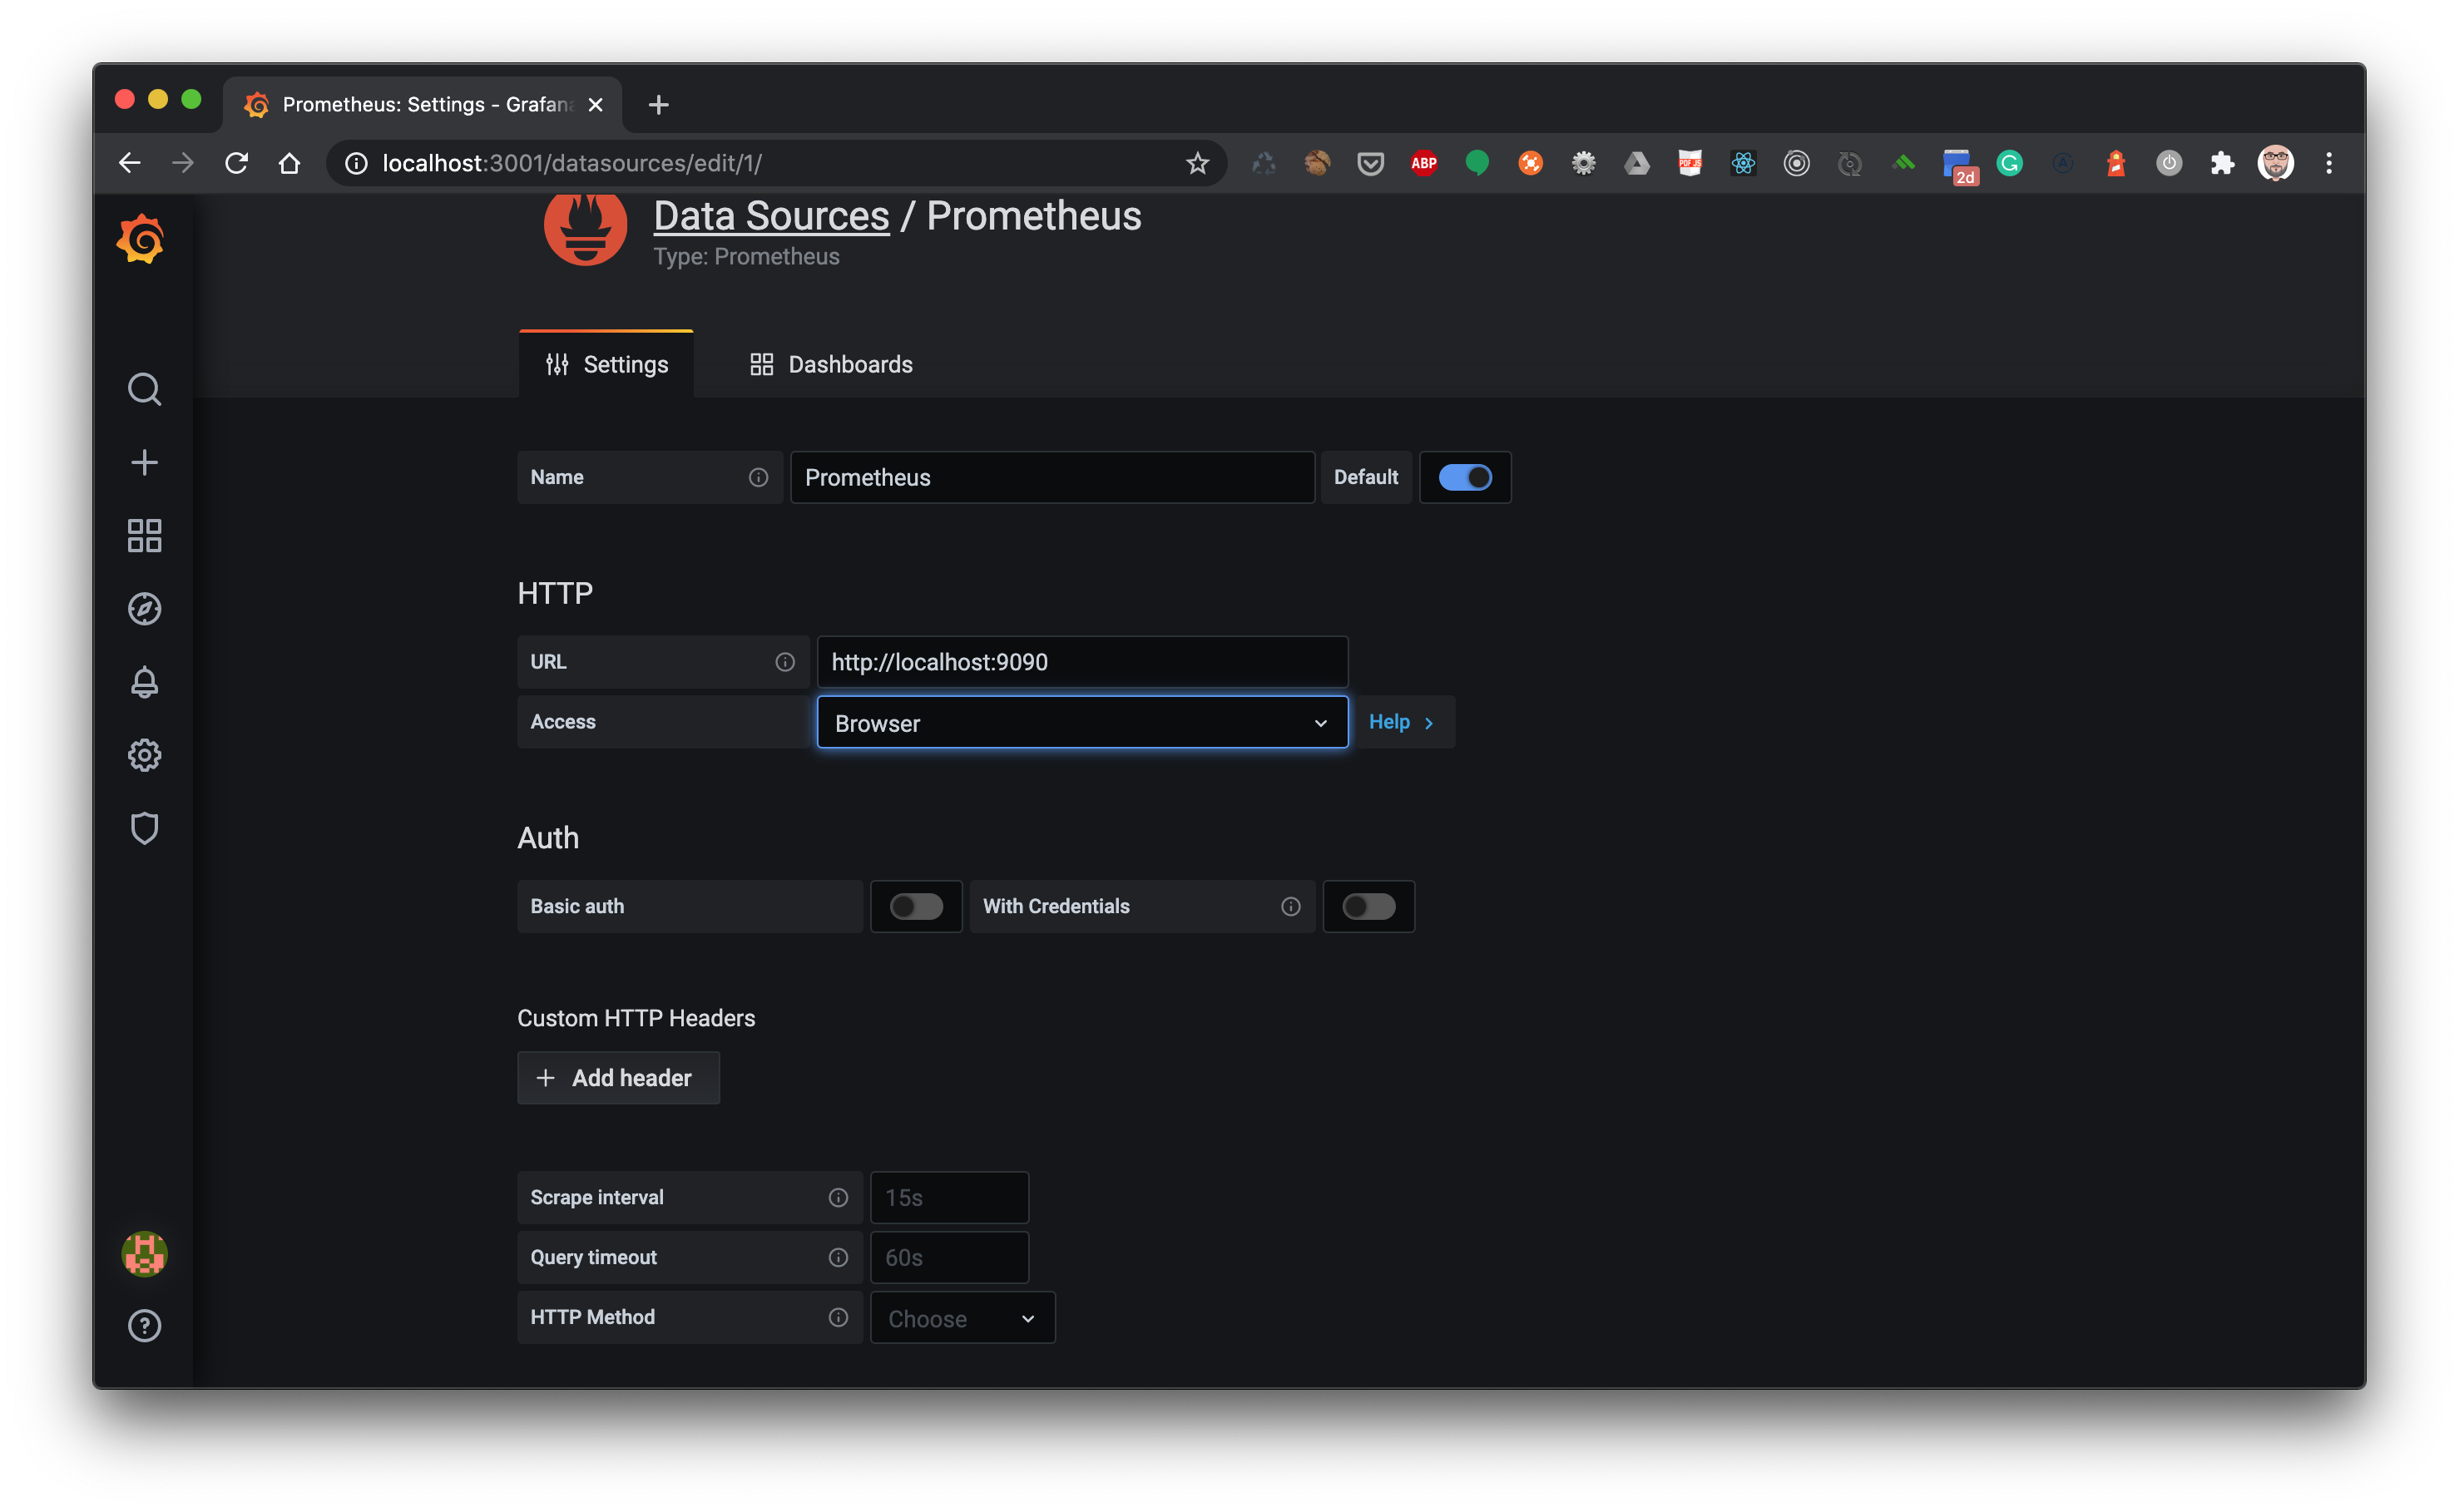
Add our Prometheus data source.
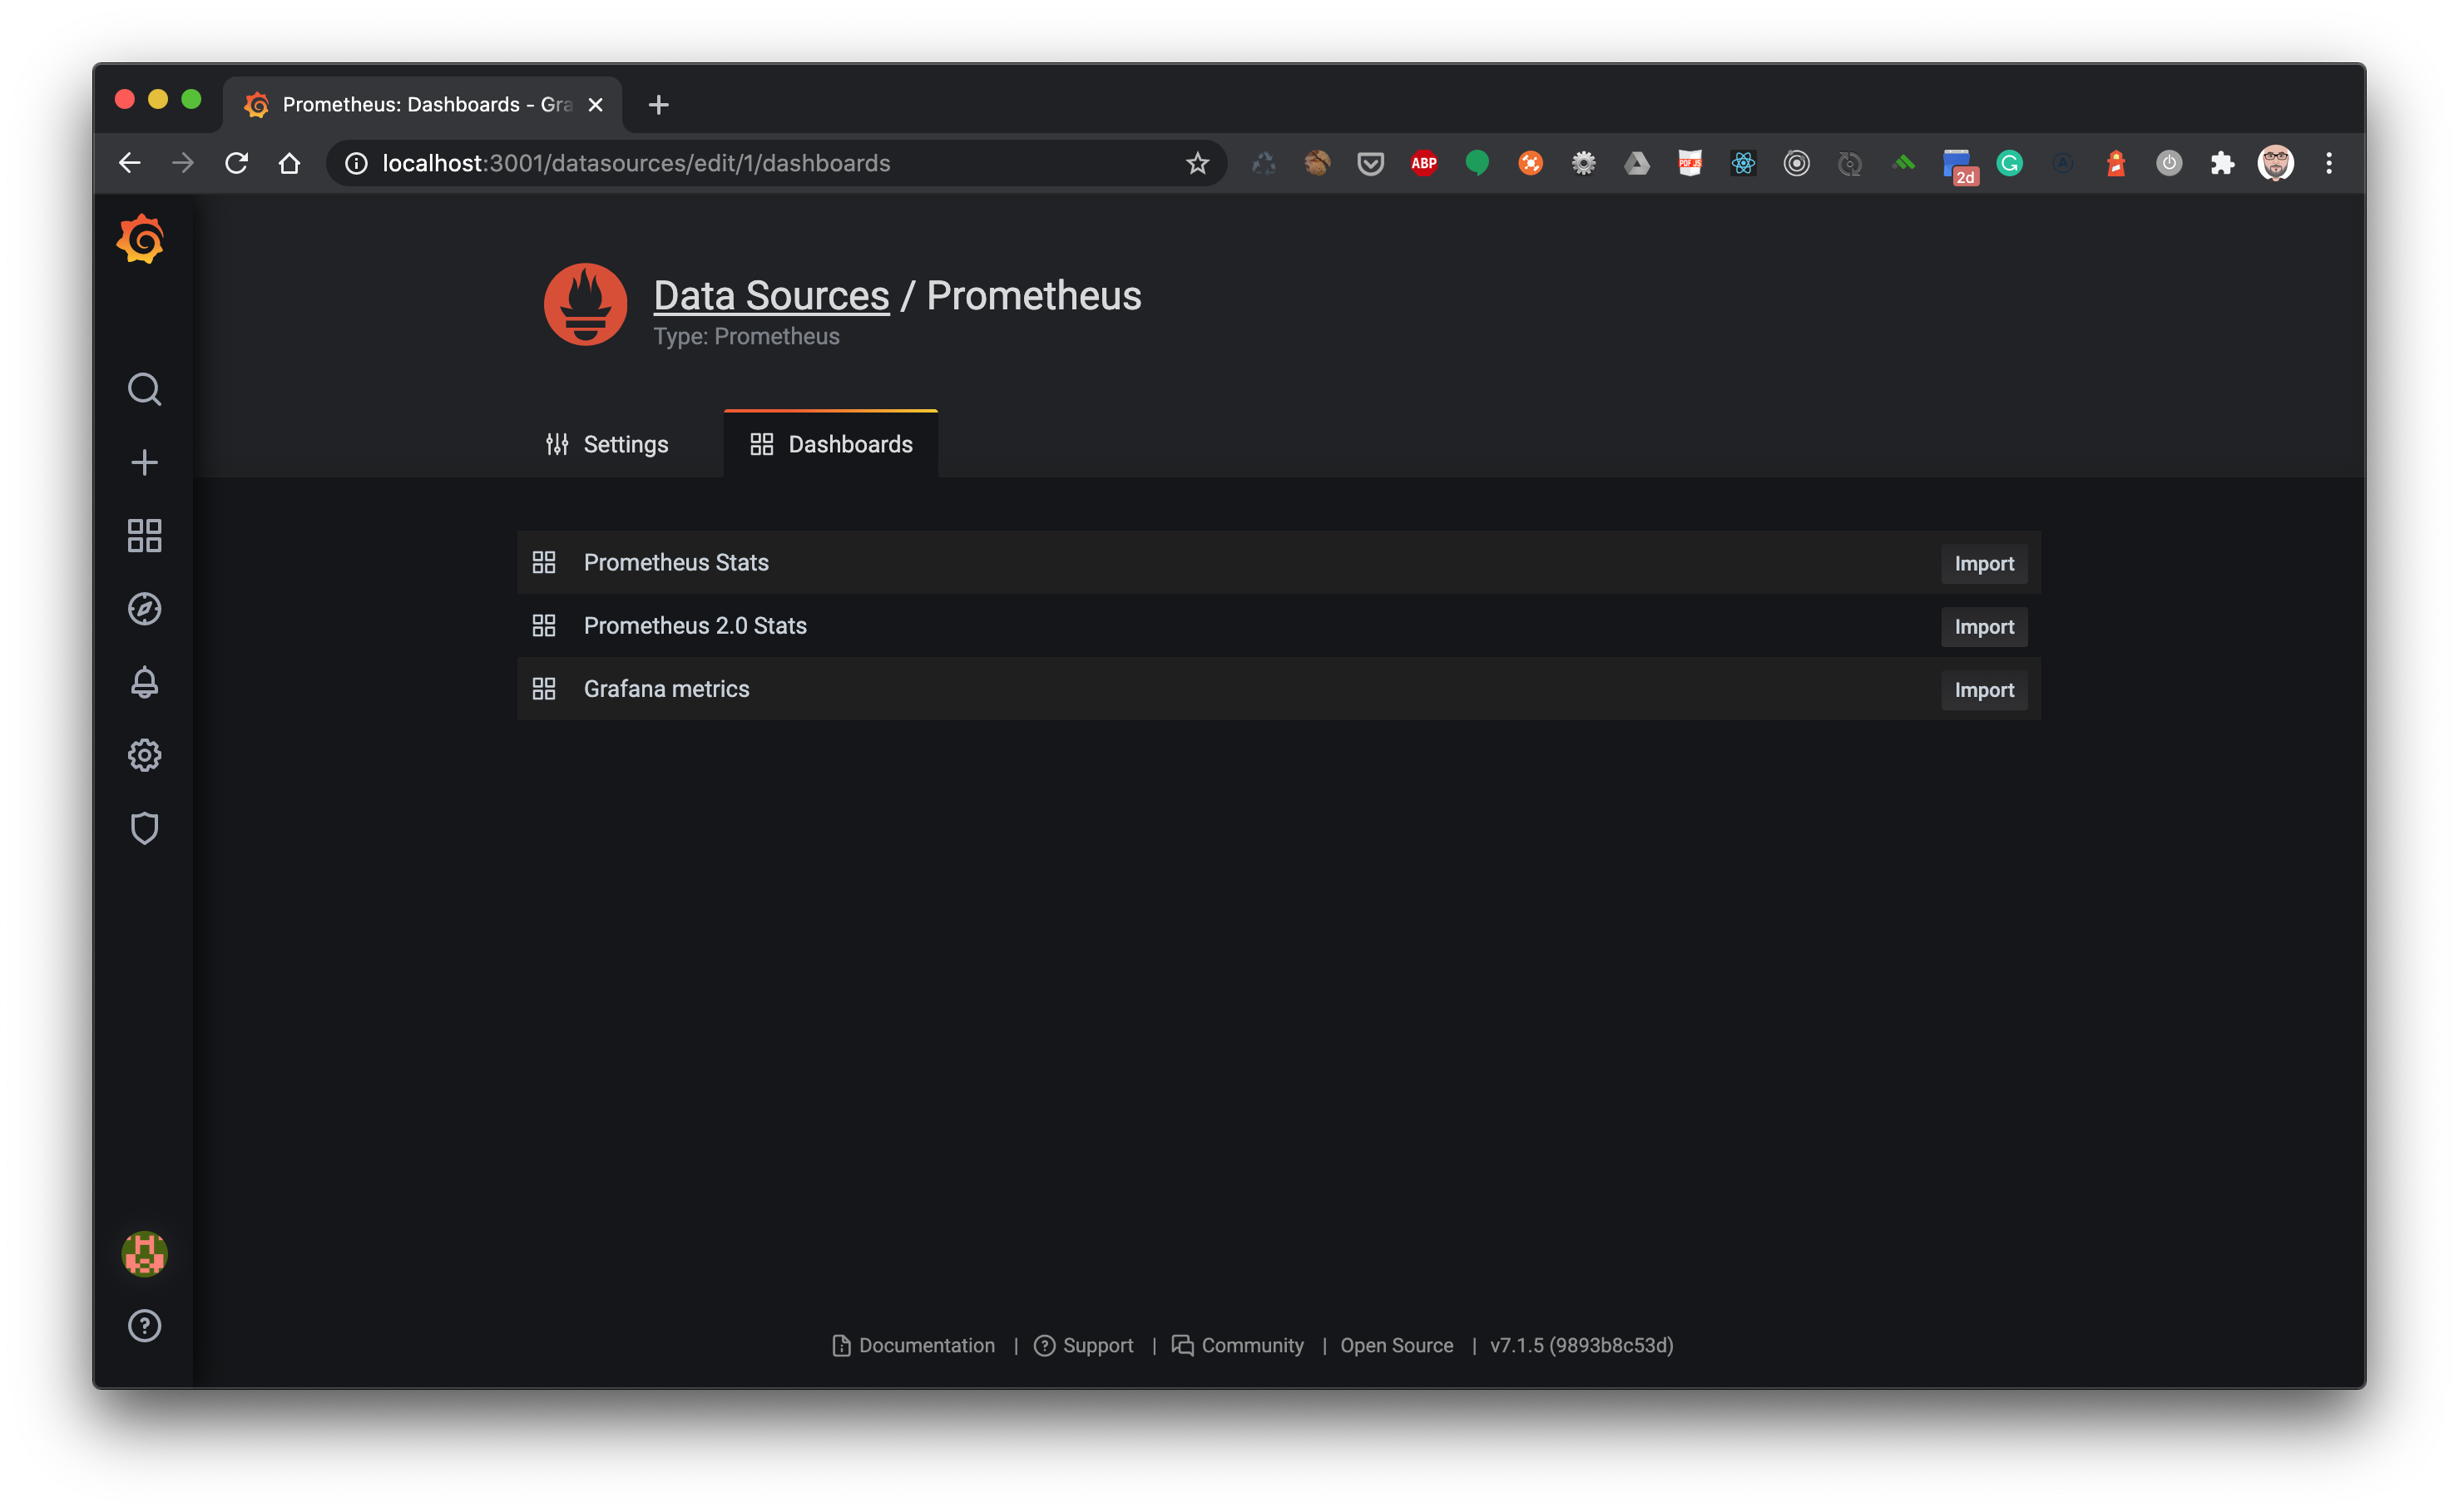
Import a default dashboard.
#Play Try to add new graphs and alerts.